
Projects One dashboard for board-level membership reporting
One dashboard for board-level membership reporting
Growth and membership data from WordPress and MemberPress, pulled into one reporting dashboard with live graphs.
- How long
- 2022 to 2023
- My role
- Software ArchitectureDatabase Management, Frontend Development, Backend Development
- Kind of project
- IntegrationMedium project
The problem.
Board members needed to see membership growth and trends, but the data lived in separate places: a WordPress site, the MemberPress membership plugin, and other sources. Nobody had one place to look.
What I did.
I built a system that connects directly to the WordPress database and pulls exactly the data needed, including the custom fields that MemberPress’s own reporting doesn’t expose. That data gets reorganised into a dedicated PostgreSQL database, then shown on a dashboard of graphs, refreshed from WordPress on demand.
What they got.
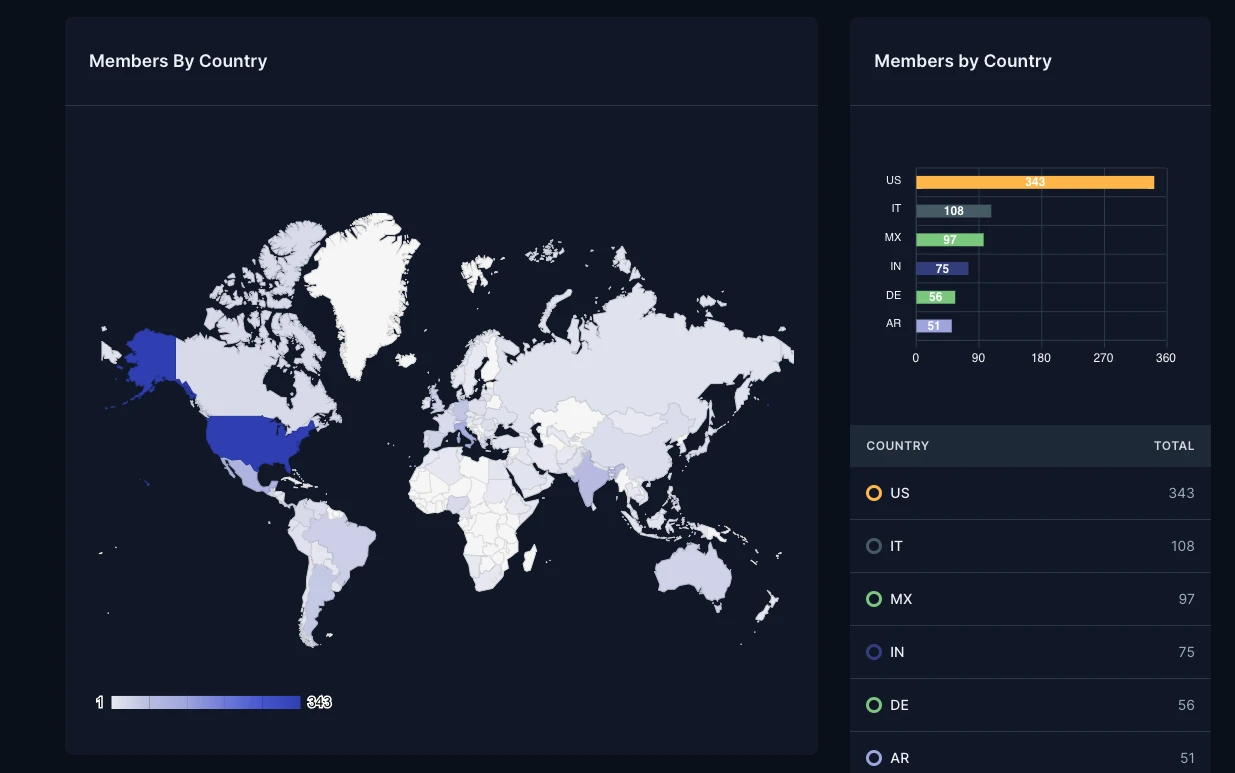
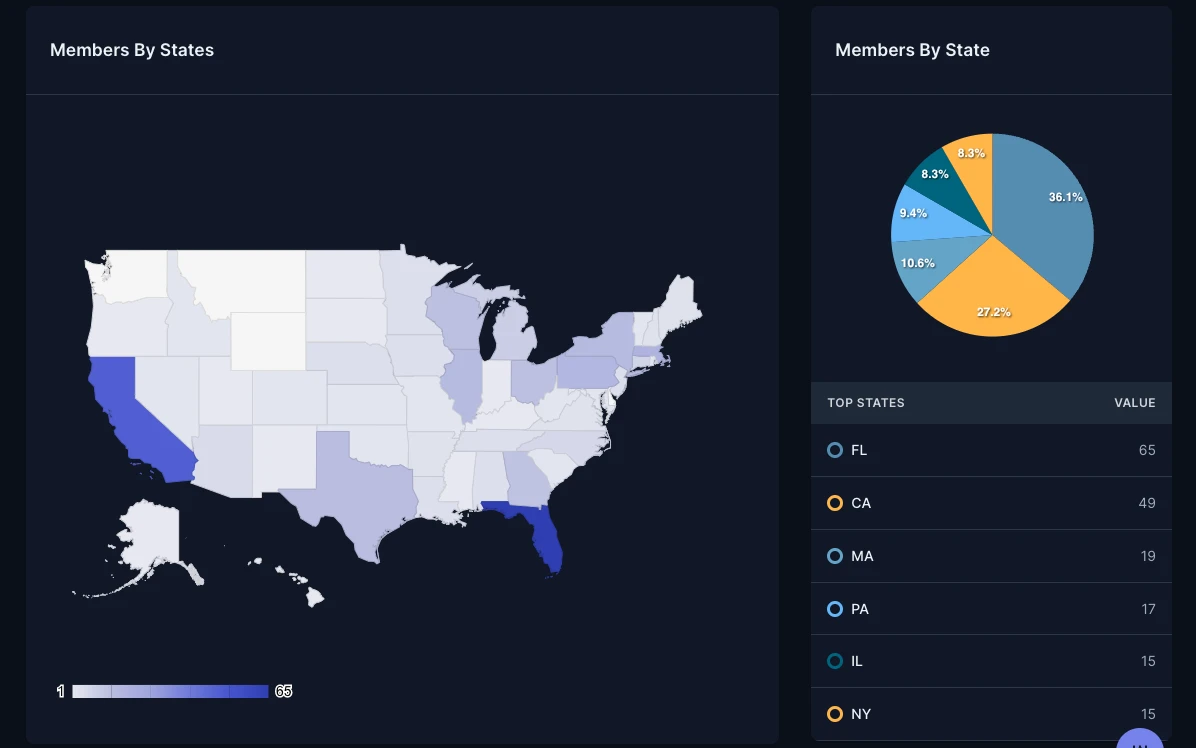
One dashboard the board can open to see current members, new members and growth trends, without logging into multiple systems or waiting on a manual report.
Screens from the build.
For your technical person
Stack. Two Node.js servers: an API server for the back end and a Next.js server for the front end. PostgreSQL for the reporting data, reading from the WordPress MySQL database. MaterialUI, with React and Google charts for the graphs. Endpoints tested in Postman. Deployed with Docker on Digital Ocean droplets, with CI/CD from GitHub.
Why not the MemberPress API. MemberPress's own endpoints didn't return the detail this business model needed, especially the data held in custom fields. So the API server connected straight to the WordPress MySQL database over SSH and pulled only the fields it needed from the relevant tables.
Reshaping the data. WordPress spreads a member's data across several tables and packs some of it into serialized arrays. The API server collated and sorted it into custom PostgreSQL tables with one field per data point and one row per member, so reports ran on simple, fast SQL queries. A "data update" button on the dashboard pulled the latest data from WordPress on demand.
One place to look. The API server also brought in other sources, such as Google Analytics, so board members had a single view instead of logging in to several reporting systems. Only the Next.js server ever talked to the API server.
Security. The API server accepted requests only from the front-end server's IP. Every endpoint ran authentication middleware and input validation, and the database connections used CA certificates and login authentication.
Timeline. 4 months, 2022 to 2023.
Related work.
The service behind this project
Your business system online, for your whole team and your customersRunning into the same problem? Tell me about yours.
+27 87 150 9305Monday to Friday, 09:00 to 20:00 SAST. Or email info@antondevilliers.com.